SELF-INITIATED · SPECULATIVE CONCEPT
A comprehensive, data-rich platform for venture capital professionals to manage and monitor investment portfolios designed end to end from research, without access to the firm's actual tools or requirements.
ROLE
Product Designer
PROJECT TYPE
Speculative, self-initiated
AUDIENCE
Mid–senior VC staff
DELIVERABLE
Dashboard concept + IA
01
Problem statement
This was a speculative design project created without access to Sequoia Capital's actual tools or detailed requirements. The challenge was to conceptualize an intuitive portfolio tracking dashboard for venture capital professionals based on industry research and assumed user needs.
Working primarily from general VC workflow knowledge, I made design decisions without screenshots, user feedback, or specific business constraints. The goal was to demonstrate my ability to design a data-rich financial platform that could streamline portfolio management for investment professionals.
WHAT I DID NOT HAVE
Interviews, usability testing, or
client validation
03
Information
architecture
I mapped the product as six top-level areas, each resolving into the screens and actions a portfolio team actually performs. The map fixed the navigation model before any visual design: a persistent left rail for the six areas, and a top bar carrying only search and notifications.

TOP NAVIGATION BAR
Search bar and notifications icon only — the top bar stays out of the
way so the data holds the screen.
LEFT-SIDE NAVIGATION MENU
Dashboard, Investments, Analytics, Reports, Collaboration, Settings —
persistent, with a single green active state.
02
Understanding the target audience was crucial. I developed two personas representing mid to senior-level employees at a venture capital firm; they guided every subsequent decision about hierarchy, density, and which metrics earn space on the default view.
RK
Rajesh Kumar
Investment Analyst · Age 35 · Bangalore, India
Over 10 years of experience in venture capital and private equity.
Holds an MBA in Finance from a prestigious Indian institute.
PAIN POINTS
Limited visibility into real-time portfolio updates.
Difficulty accessing comprehensive data for timely decision-making.
Managing multiple tasks and
projects simultaneously.
NEEDS
Detailed analytics and performance metrics.
Efficient collaboration tools for team communication.
A user-friendly, productivity- focused interface.
DS
Deepa Sharma
Investment Manager · Age 40 · Mumbai, India
A strong background in finance and over 15 years with the firm. Holds
the Chartered Financial Analyst (CFA) designation.
PAIN POINTS
Balancing strategic investment decisions with day-to-day operations.
Ensuring regulatory compliance while managing risk effectively.
Limited time for in-depth analysis due to administrative tasks.
NEEDS
Portfolio management tools with real-time updates.
Advanced analytics for risk assessment and strategic planning.
Secure, efficient communication channels for the team.
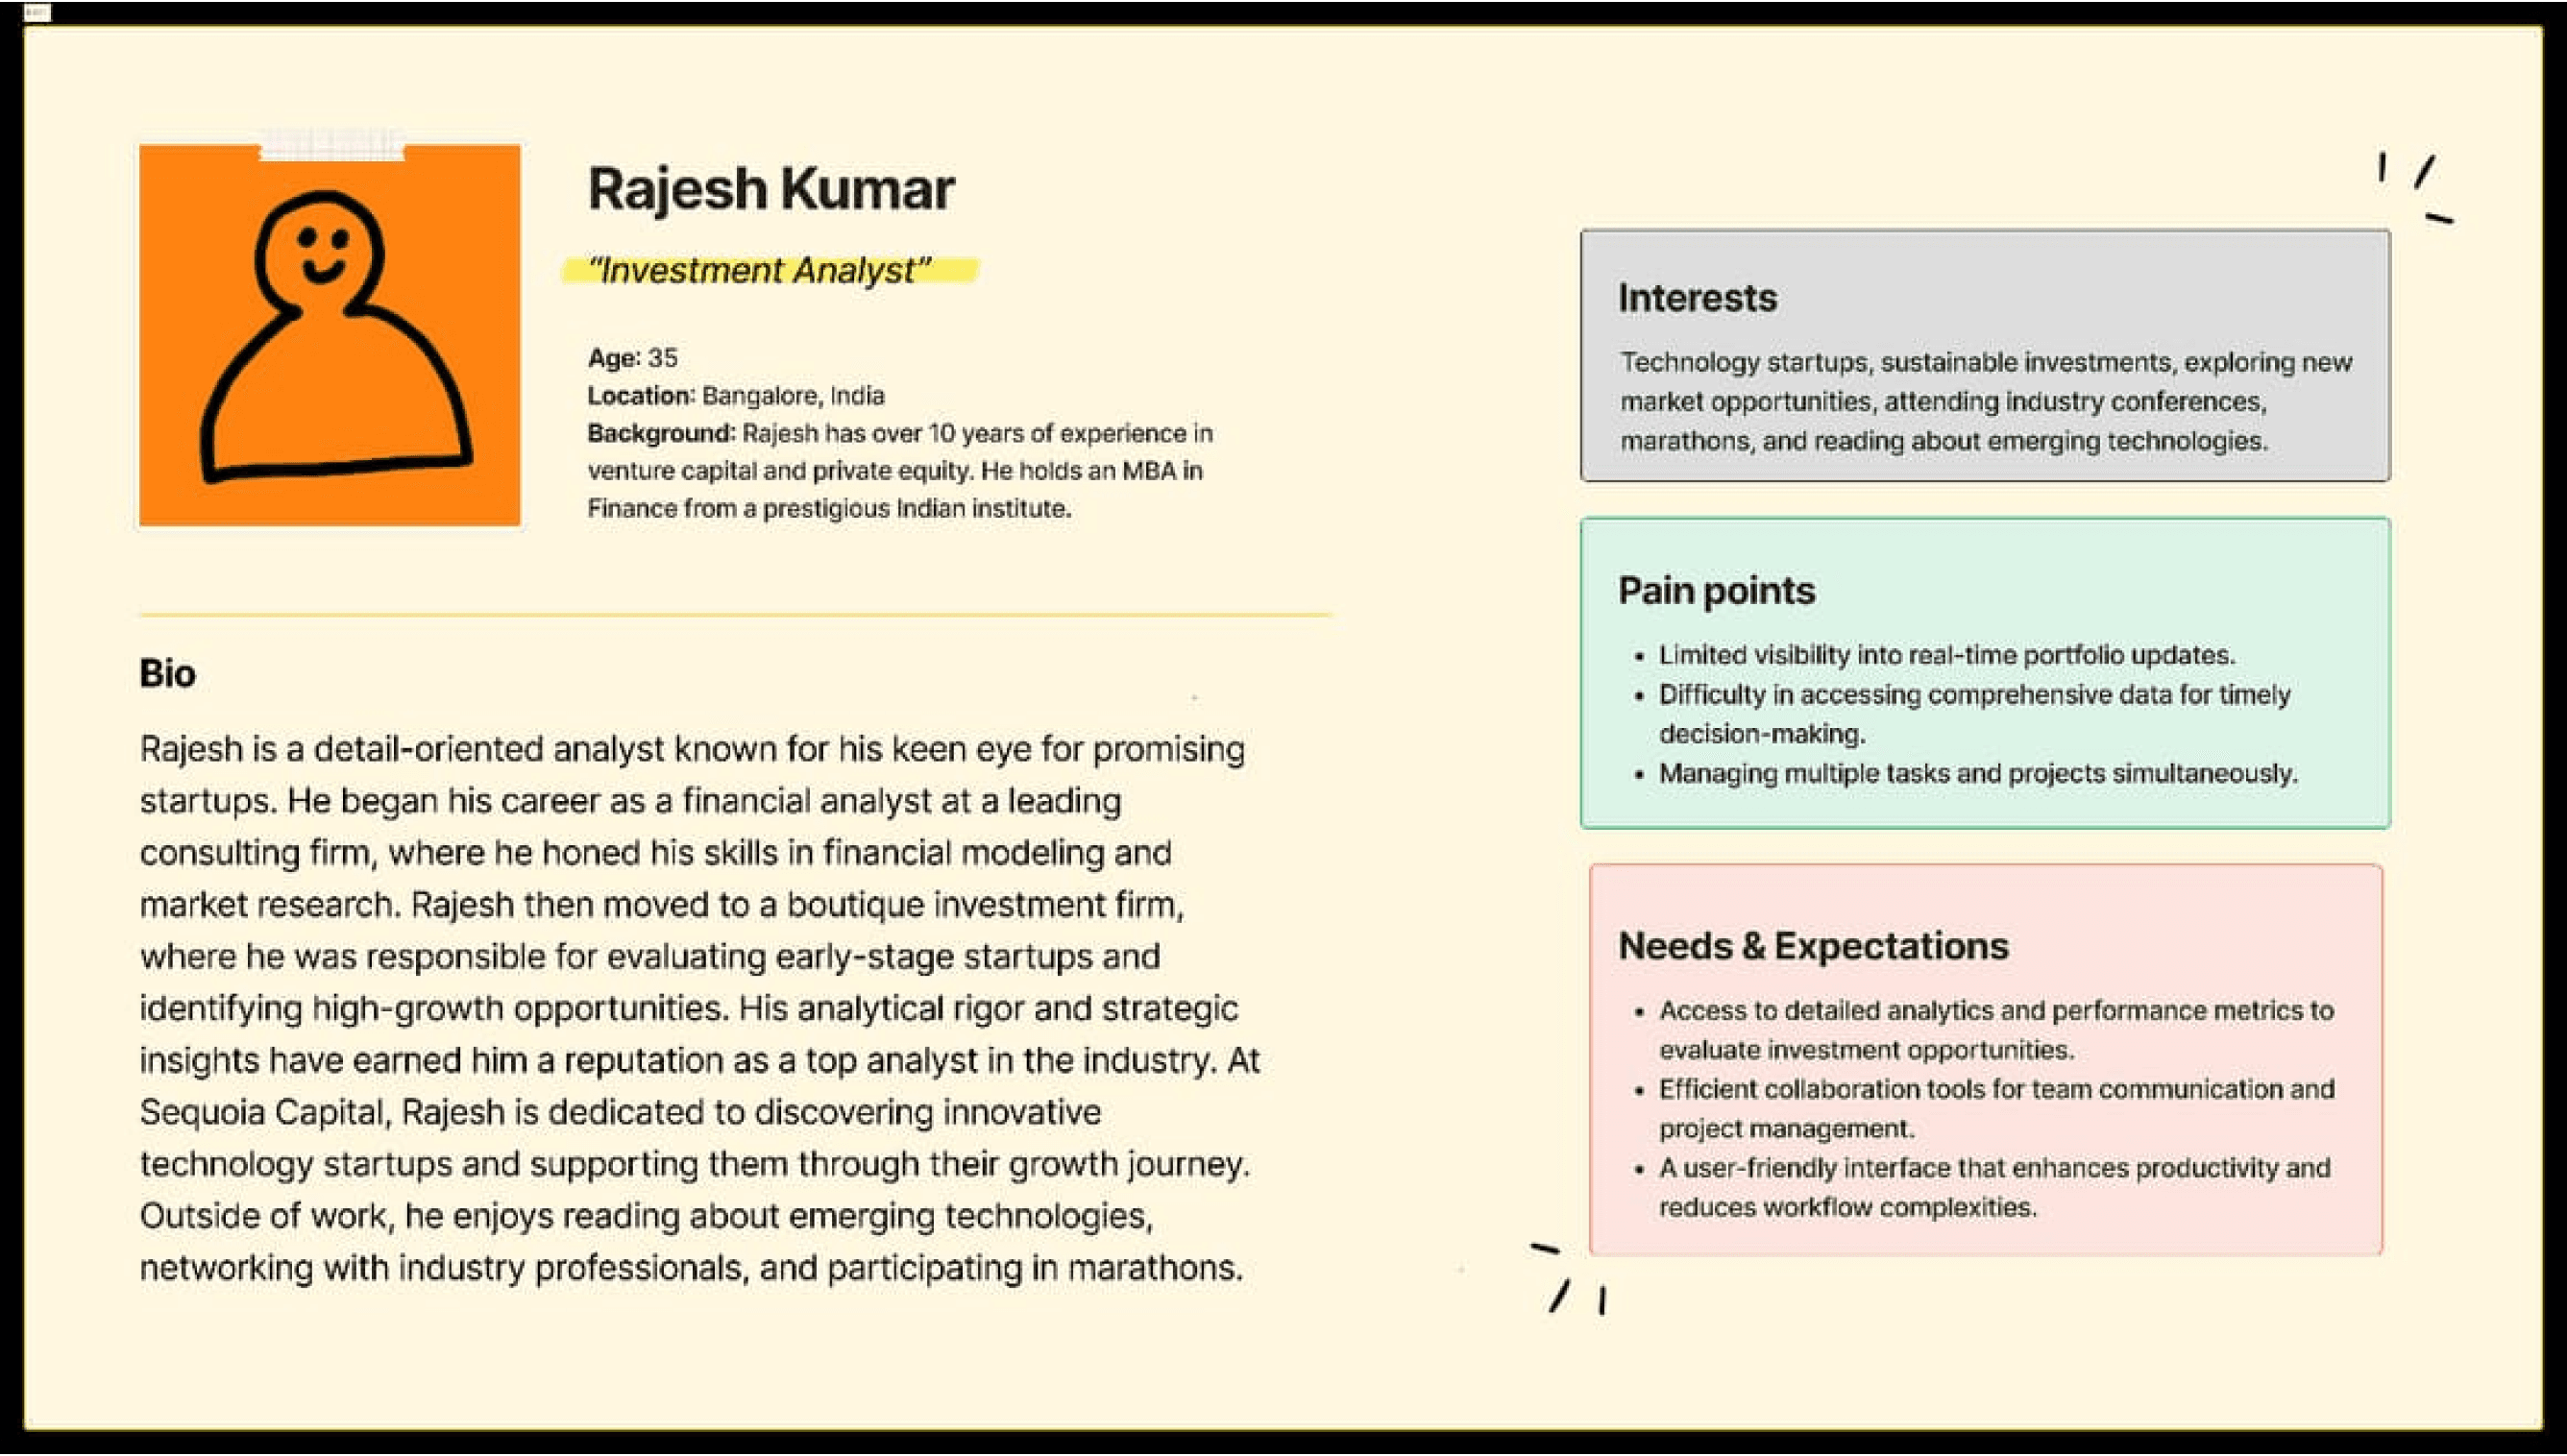
Original persona sheet — Rajesh Kumar

Original persona sheet — Deepa Sharma
04
The dashboard
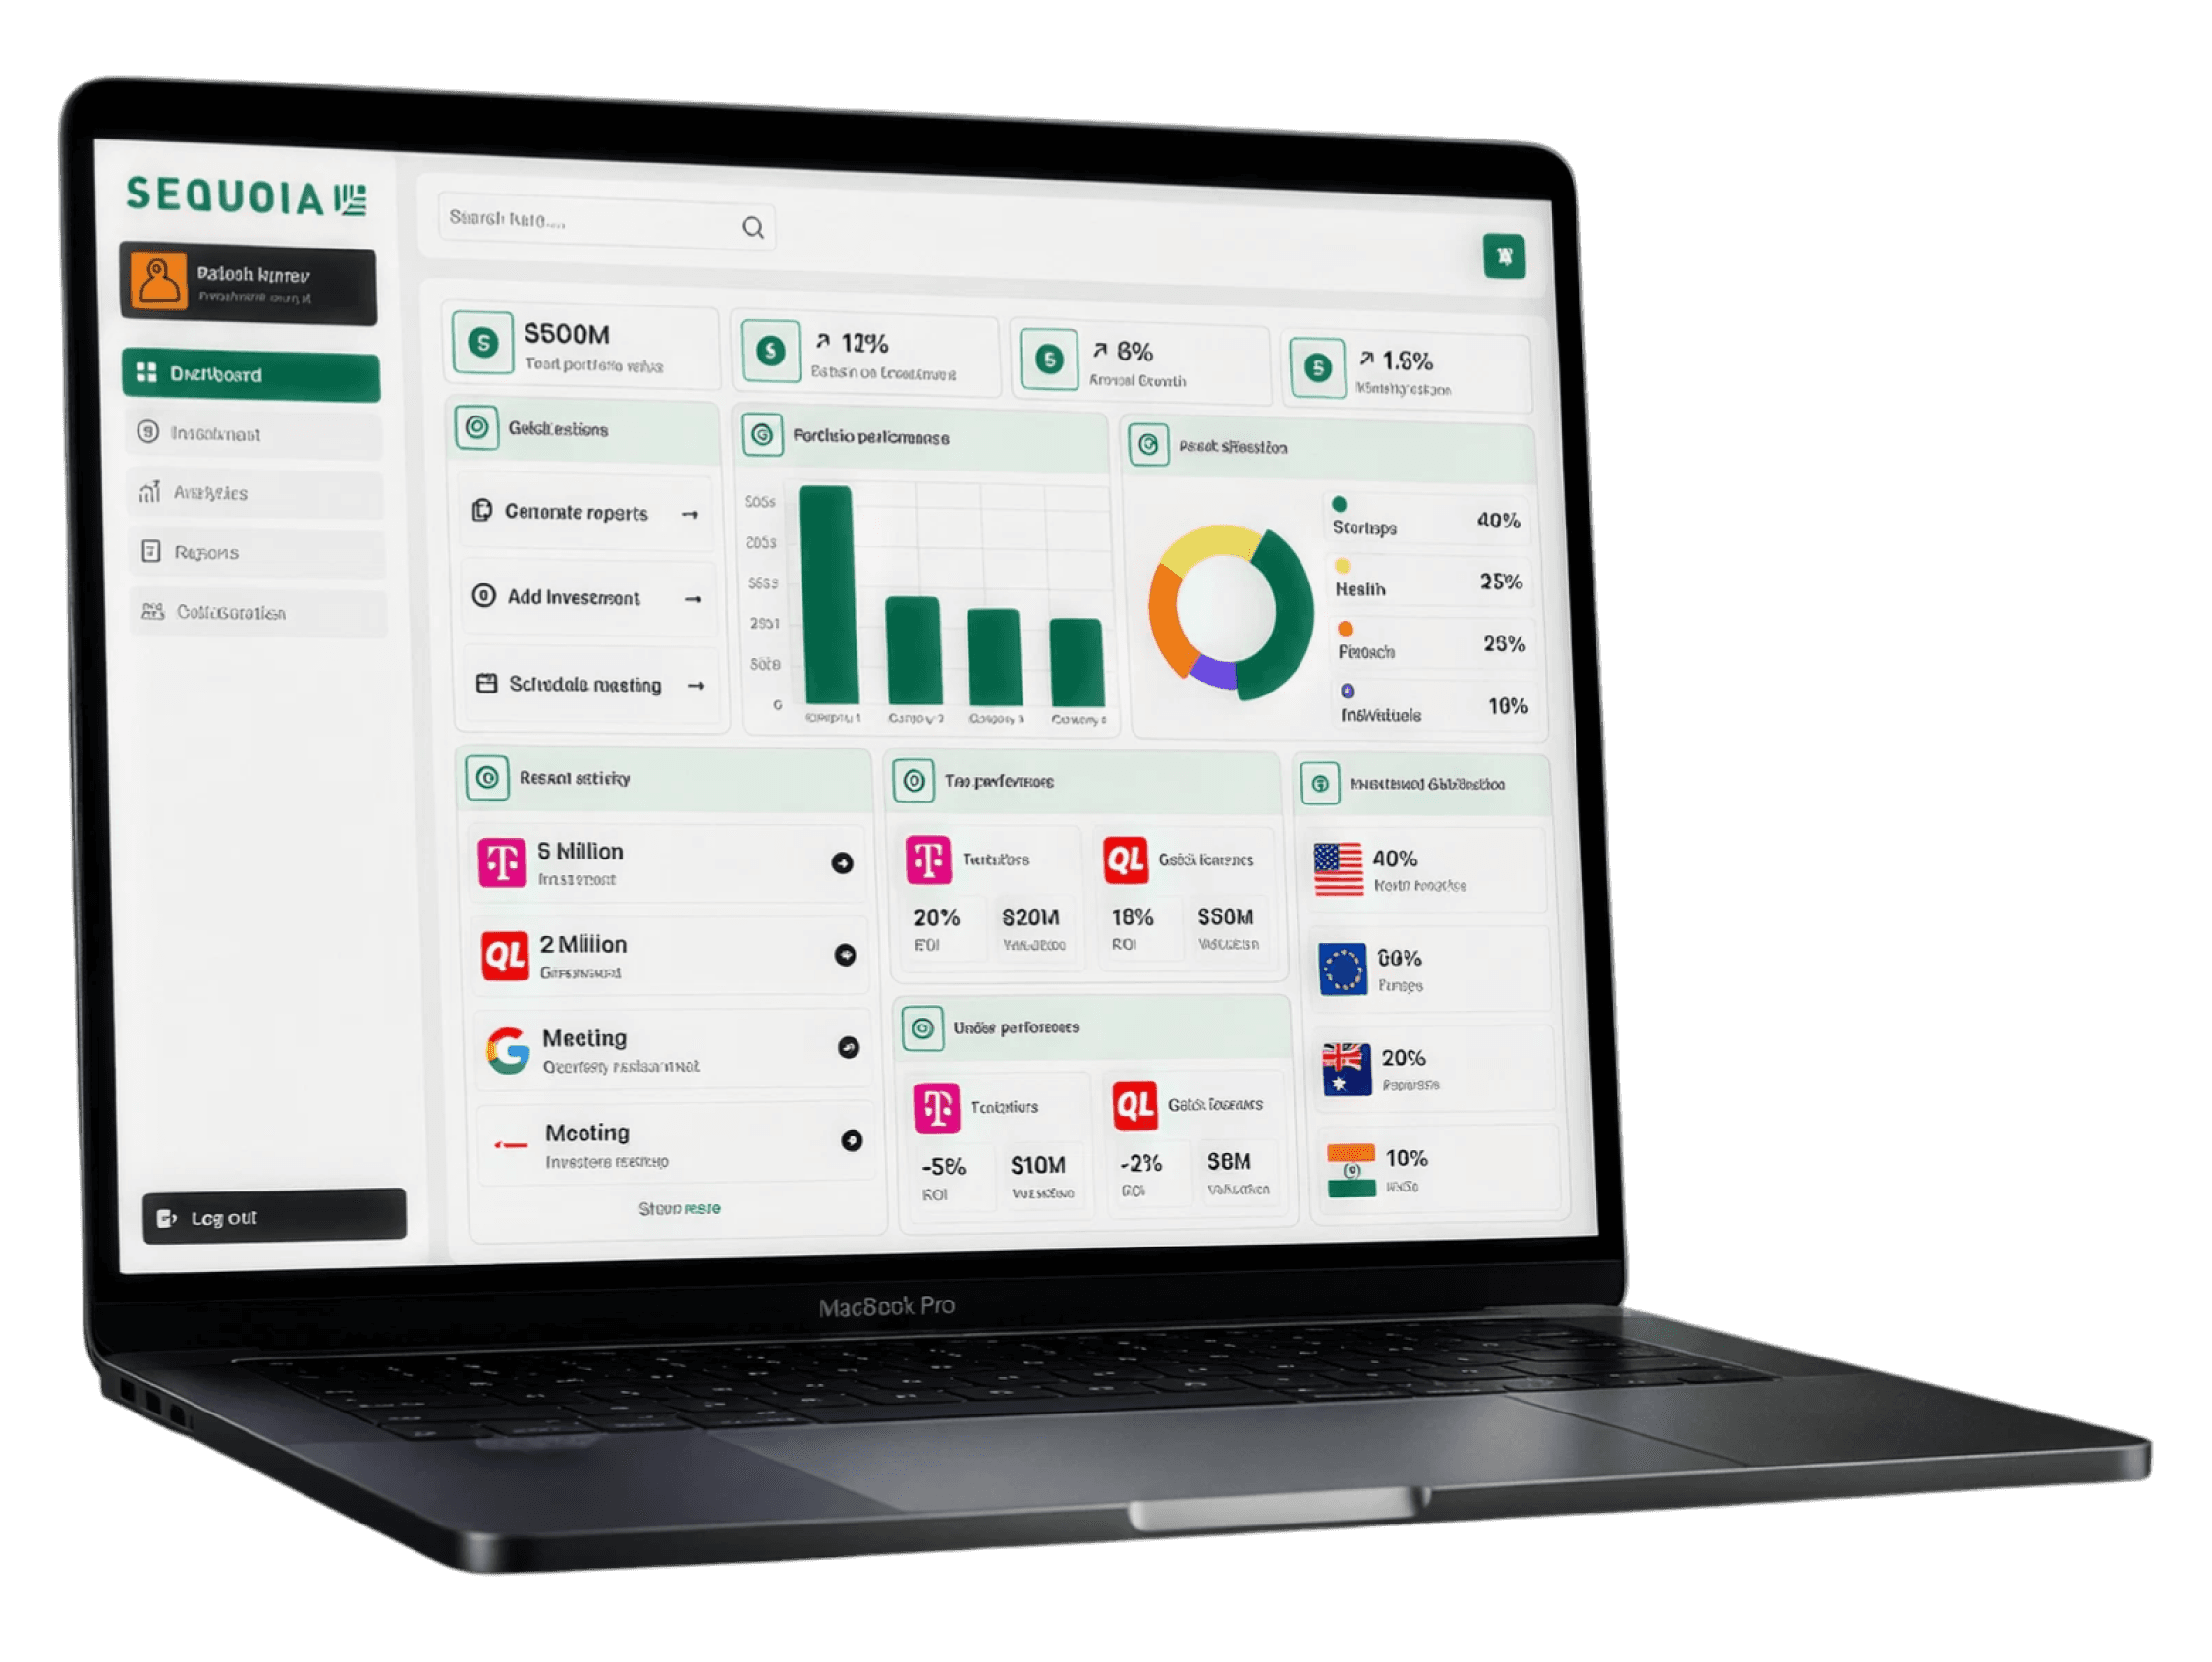
One default view answering the analyst's first three questions what is the portfolio worth, what is it returning, and where is it concentrated before any drill-down. Quick actions sit next to the charts so the common tasks are one click from the data that prompts them.

$500M
Total portfolio value
12%
Return on investment
8%
Annual growth
1.5%
Monthly return
ASSET ALLOCATION
Startups
40%
Health
25%
Fintech
25%
Individuals
10%
INVESTMENT DISTRIBUTION
North America
40%
Europe
30%
Australia
20%
India
10%
ON THE DEFAULT VIEW
Quick actions: generate reports, add investment, schedule meeting.
Portfolio performance by company, 2020– 2024.
Recent activity feed with investments, divestments and meetings.
Top and under performers with ROI and valuation side by side.
INTERFACE PALETTE
#007557
Primary
#F0FDF4
Panel header
#27272A
Ink / chrome
#FCF36B
Data — health
#F97316
Data — fintech
#9333EA
Data — individuals
#F5F5F5
Canvas
05
Summary &
reflection
This project set out to develop a comprehensive, user-friendly dashboard for Sequoia Capital's internal and SaaS use. Despite the limited time available due to my current workload, I built a solution that addresses the primary needs of the users research, personas, information architecture, and visual design.
There is room for further development and refinement. No user testing or client validation occurred, and every metric shown is illustrative example data rather than real portfolio figures. What the project does demonstrate is my ability to design effective, intuitive solutions for a data-rich domain within a tight deadline.
WOULD DO NEXT
Interview practising VC
analysts and test the default
view against real weekly tasks.
OPEN QUESTION
Whether a single overview can
serve both the analyst and the
manager, or needs role-based
views.
HONEST CAVEAT
Speculative and self-initiated:
not commissioned by, affiliated
with, or validated by Sequoia
Capital.
Thank you for reading.
If you'd like to talk through the thinking behind this project, or
anything else, I'd be glad to hear from you.
Contact Me
Speculative concept project · Not affiliated with or endorsed by Sequoia Capital · All figures are example data